

Amazon EventBridge is a serverless event bus that makes it easy to connect applications together using data from your own applications, Software-as-a-Service (SaaS) applications, and AWS services.
In this post, I will be building a simple solution to monitor CI/CD pipeline of React app using CircleCI, CloudWatch and EventBridge.
So combining everything, I do the following steps:
- Create an EventBridge Rule.
- Create a Lambda function to log the CircleCI events.
- Config CircleCI that sends job status to EventBus.
Prerequisites
The following must be done before following this guide:
- Setup an AWS account
- Install the AWS CLI
- Configure the AWS CLI with user credentials
- Setup an CircleCI account
Creating an AWS Lambda Function
Create a Lambda function to log the CircleCI events. Specify this function as target of EventBridge rule in next step.
This is what the lambda function should look like:
module.exports.circleciLog = async event => {
  console.log(event);
  return null;
};
For more details, check our official tutorial here.
Creating an EventBridge Rule with custom source
You can create rule from Amazon EventBridge console. In our case I am going to use AWS CLI:
The following command creates a rule with custom source circleci.myapp
$aws events put-rule --name "circleci.myapp" --event-pattern "{"source":["circleci.myapp"]}"
Next, get Arn of lambda function circleci-log-dev-circleci which was created in previous step,
$aws lambda get-function --function-name circleci-log-dev-circleciLog --query Configuration.FunctionArn
Copy Arn, then add target to rule circleci.myapp.
$aws events put-targets --rule circleci.myapp --targets "Id"="1","Arn"="arn:aws:lambda:REGION:ACCOUNTID:function:circleci-log-dev-circleciLog"
Okay all done! Let’s create CircleCI config and push project to Github.
Configuring CircleCI
CircleCI configuration is stored in a single YAML file located at ~/.circleci/config.yml, for more details, check out here.
In the config, CircleCI runs following command to Send custom events to EventBridge so that they can be matched to rules:
aws events put-events --entries '[{ "Source": "circleci.myapp", "DetailType": "CircleCI state change", "Detail": "{ "app": "myapp", "type": "fail" }"}]'
Theconfig.yml should look like:
https://medium.com/media/e8a20d4adc761effc3d0cb7b11e7af92/href
All set to go, Try it out!
- Push a commits to a remote repository master branch.
- Open the Amazon CloudWatch console.
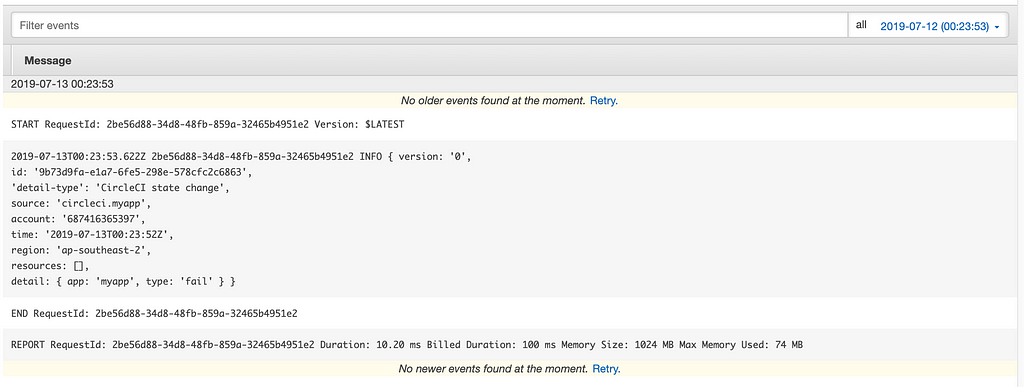
- In the navigation pane, choose Logs, filter/aws/lambda/circleci-log-dev-circleciLog .
Here is what logs look like:
Creating a custom CloudWatch metric to monitor Lambda logs
This is an optional step, I found it is really useful, because it allows me to monitor for specific strings in my Lambda logs and send an alert when found.
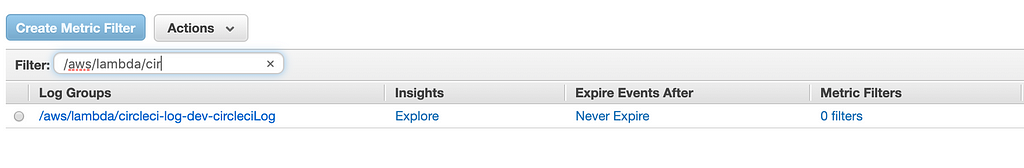
- Go to your CloudWatch console.
- Select the checkbox next to your lambda log group, Click “Create Metric Filter”.
- In filter pattern enter something like “fail”. Click “Assign Metric”.
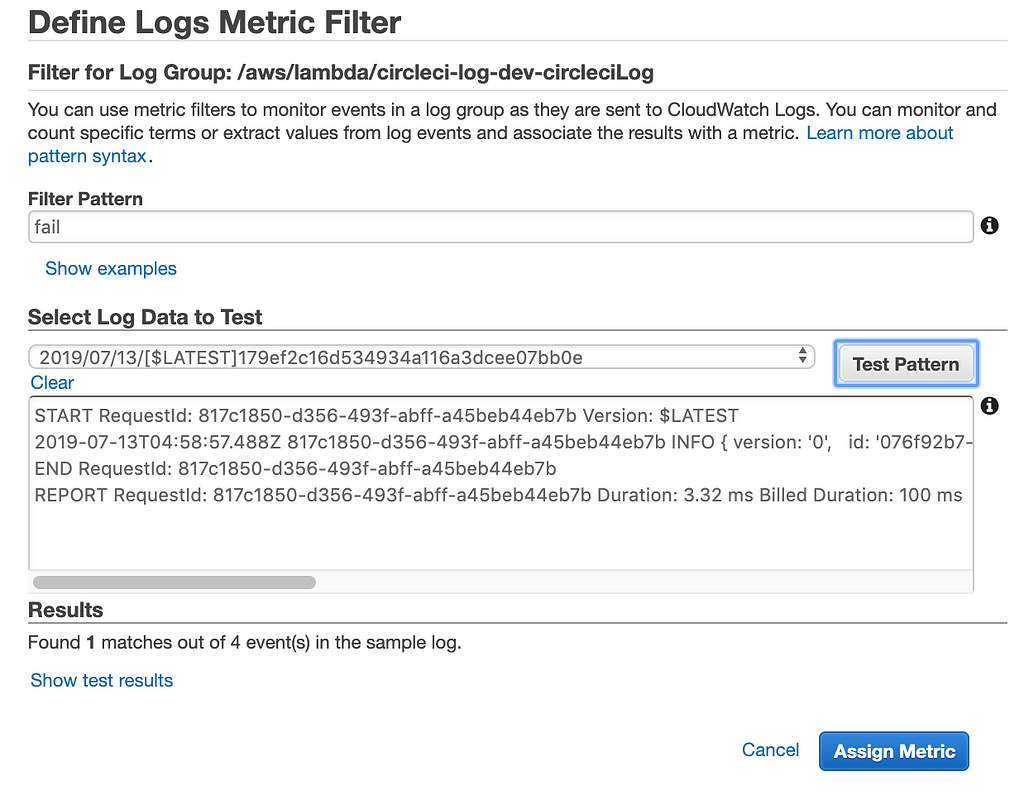
- Enter a name for this metric (this name can be later on be used to setup an alarm).
- Click “Create filter”.
- Go to the “Alarms” section.
- Click “Create Alarm”.
- At the bottom of the list of metrics categories, find the “Custom Metrics” dropdown, and select “Log metrics”.
- Find and select your metric name, click “Next”.
- Select a reasonable period of time, then select “Sum” as the Statistic.
- Setup the alarm to be triggered when the metric is “> 0” in 1 period.
That’s about it! I hope you have found this article useful, You can find the complete project in my GitHub repo.
Monitoring CI/CD Pipelines with Amazon EventBridge was originally published in HackerNoon.com on Medium, where people are continuing the conversation by highlighting and responding to this story.

